Pivot tables & charts – do more with lessanalytics
Analyze all your data with pivot tables, and create custom charts in just a few clicks
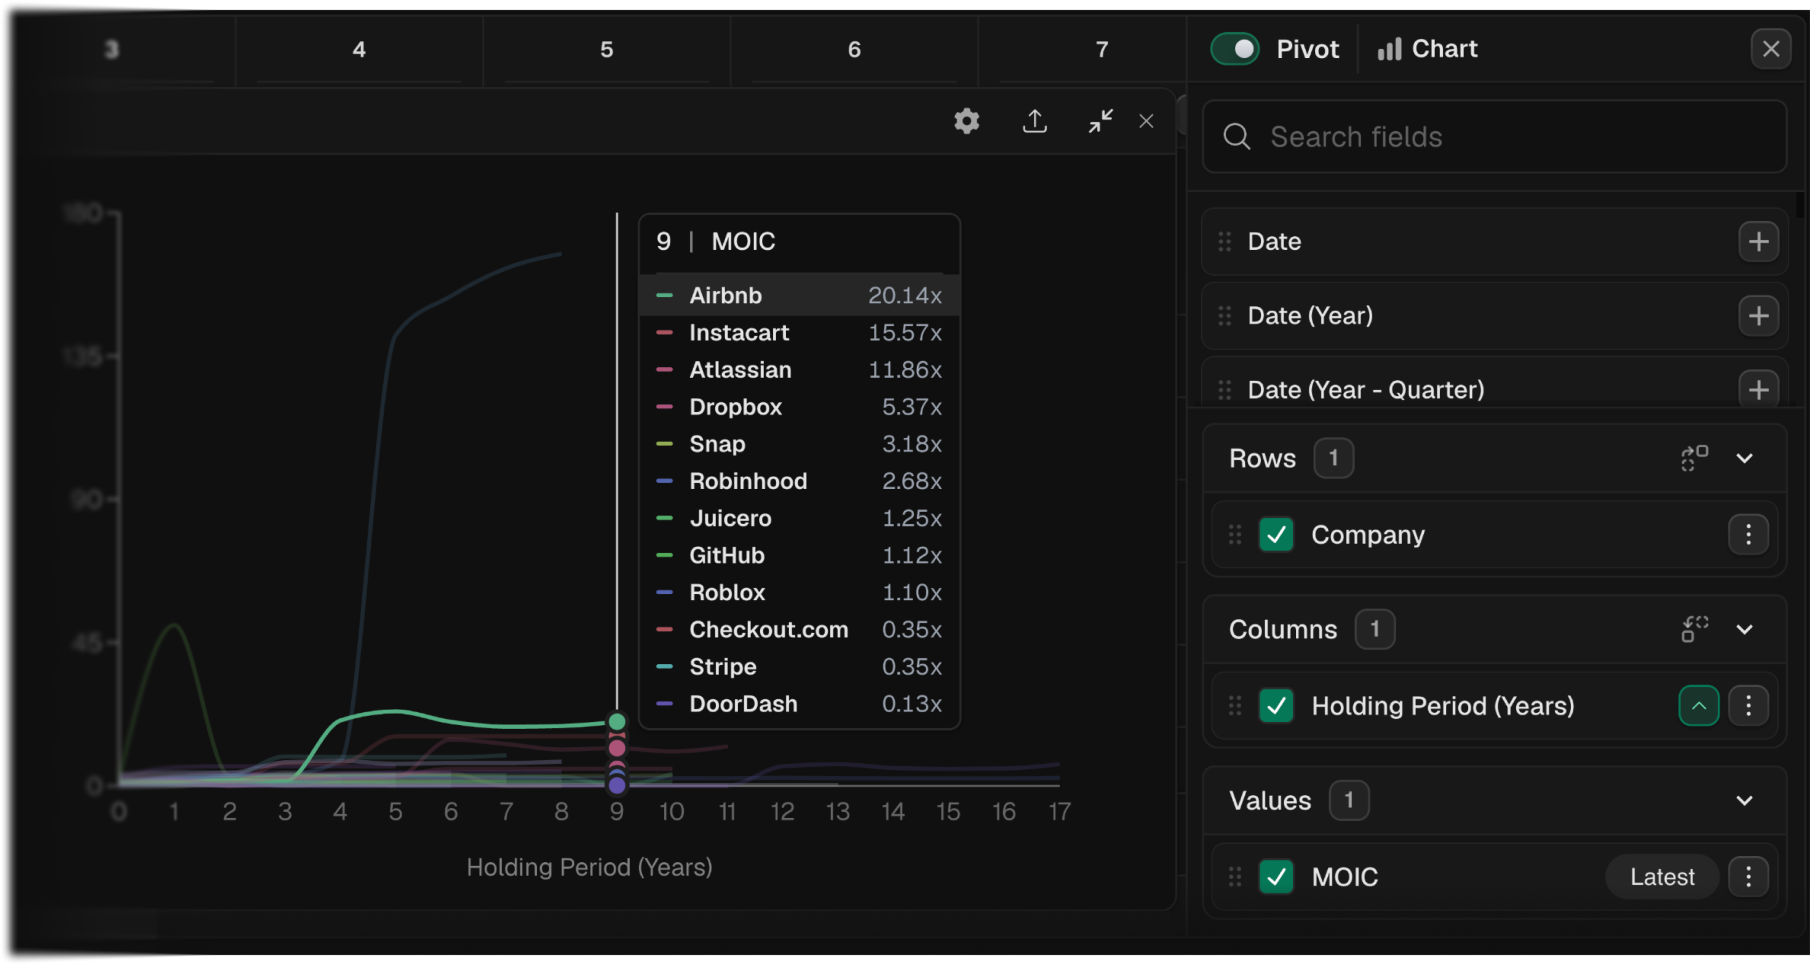
We’re excited to announce pivot tables – a powerful new way to analyze your fund and portfolio company data in Fundra. Whether you're analyzing fund performance, portfolio company metrics, or investment activity, pivot tables give you the flexibility to slice, dice, and visualize your data with ease.
With just a few clicks, you can aggregate and transform your data into custom charts and insights. Easily spot trends across your portfolio, benchmark investment progression, or analyze cap tables over time.
You can build pivot tables from any dataset in Fundra – including:
Portfolio companies
All individual investments
Investment timeline (a new view we added that includesa timeseries of all your investment related activity across all the funds you manage)
Fund performance metrics
And the list goes on – just click the pivot button in the footer of any table to get started.
And as always, you can:
Save your analysis as a reusable custom view
Share insights with your team for better collaboration
Create auto-updating dashboards that reflect real-time data
You can even create a custom view for any chart, which will automatically update as your data evolves.
With pivot tables, Fundra makes it easier than ever to run a data-driven venture fund.